Context
The ecological transition – and more particularly the climate transition, which is an essential component – is one of the major challenges of the 21st century. One of the first urgent needs of this transition is to reduce greenhouse gas (GHG) emissions in order to limit the importance of the additional greenhouse effect and the impacts of induced climate change, which endanger the habitability of our planet and the survival of living species. The COP21 decided to limit the temperature increase to 1.5°C by 2050 instead of 2.5°C. COP26 confirmed and emphasized this objective, which is currently non reachable if the situation remains unchanged, according to many experts. Carbon neutrality on a global scale and by 2050 remains the most viable alternative in order to reach this objective. It must be implemented at the regional, national and local levels and translated into actions to reduce emissions and increase storage and sequestration capacities. It appears necessary for territories to have relevant measurement methods and indicators to enable them to monitor their carbon trajectory and their contribution to the collective objective of carbon neutrality. These tools help to establish the climate diagnosis of the territories and are the first step to set realistic objectives, implement coherent strategies and identify concrete solutions to be deployed. This would maximize their chances of achieving their ambitions. Finally, these tools would allow to ensure the management and the evaluation of the actions undertaken.
Don’t wait any longer, ask for your FREE report !
How to measure the carbon storage and sequestration capacity of a territory ?
MEOSS has created MEO-Carbon : a tool dedicated to local authorities, planners and land managers. The tool is dedicated to the diagnosis and monitoring of carbon stocks and flows at the local level. MEO-Carbon is based on ADEME’s ALDO tool. Integrating updated, detailed and qualified data from satellite images allows to spatialize essential information to measure, understand and act on carbon sequestration and storage capacities at the local scale. The tool offers a cartographic and dynamic dashboard to monitor the dynamics in place and measure the actions undertaken to contribute to the national effort of carbon neutrality. The derived indicators allow the analysis and evaluation of the potential for adaptation to climate change thanks to the contribution of satellite data.
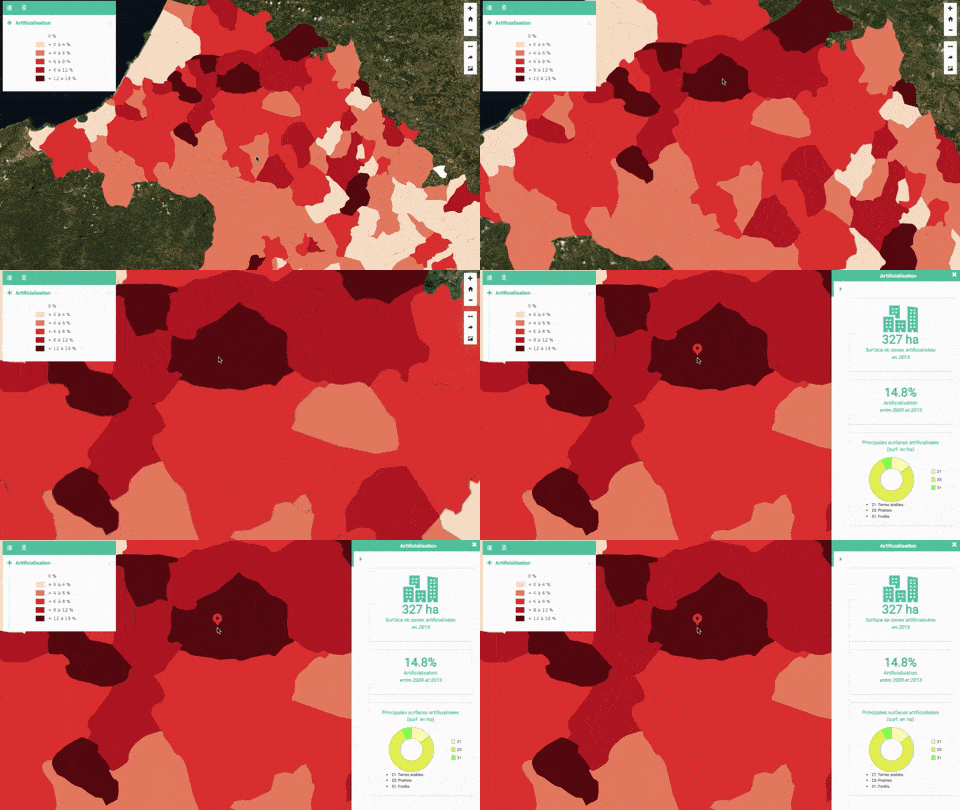
Artificialization of soils between 2009 and 2015
What does MEO-Carbon enable ?
- Mapping of carbon stocks in the three main reservoirs (soil, litter, biomass)
- Identification and location of the main changes in land cover between two vintages
- Carbon flows monitoring, including sequestration, produced between two years
The interactive map allows to dynamically provide carbon stocks and flows resulting from land occupation changes on a given territory. It provides information on the identification and location of the main sources of carbon emissions and sequestration linked to land occupation changes as well as the management practices implemented to control the issue of carbon storage and sequestration. Statistical analyses are also provided, with a detailed assessment of the dynamics of stocks and flows, and to identify the most promising actions.
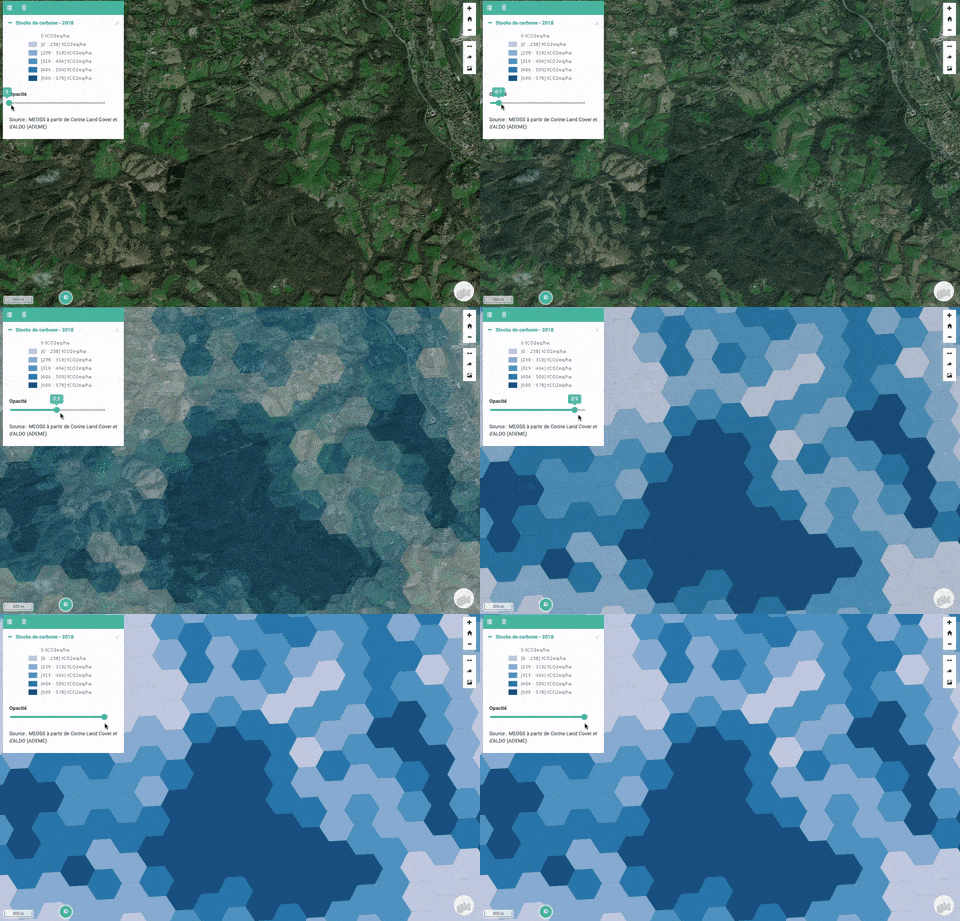
Overview of carbon stocks in 2018
The objectives of MEO-Carbon
- Propose indicators to better characterize territories and map their potential
- Support public actors in their adaptation policies for more resilient territories
- To provide a decision support tool to monitor the carbon flows. This would enable o better understand and identify actions to prioritize
- Propose a temporal monitoring through objective, robust, measurable and reliable indicators to observe the evolution of the impact of public policies
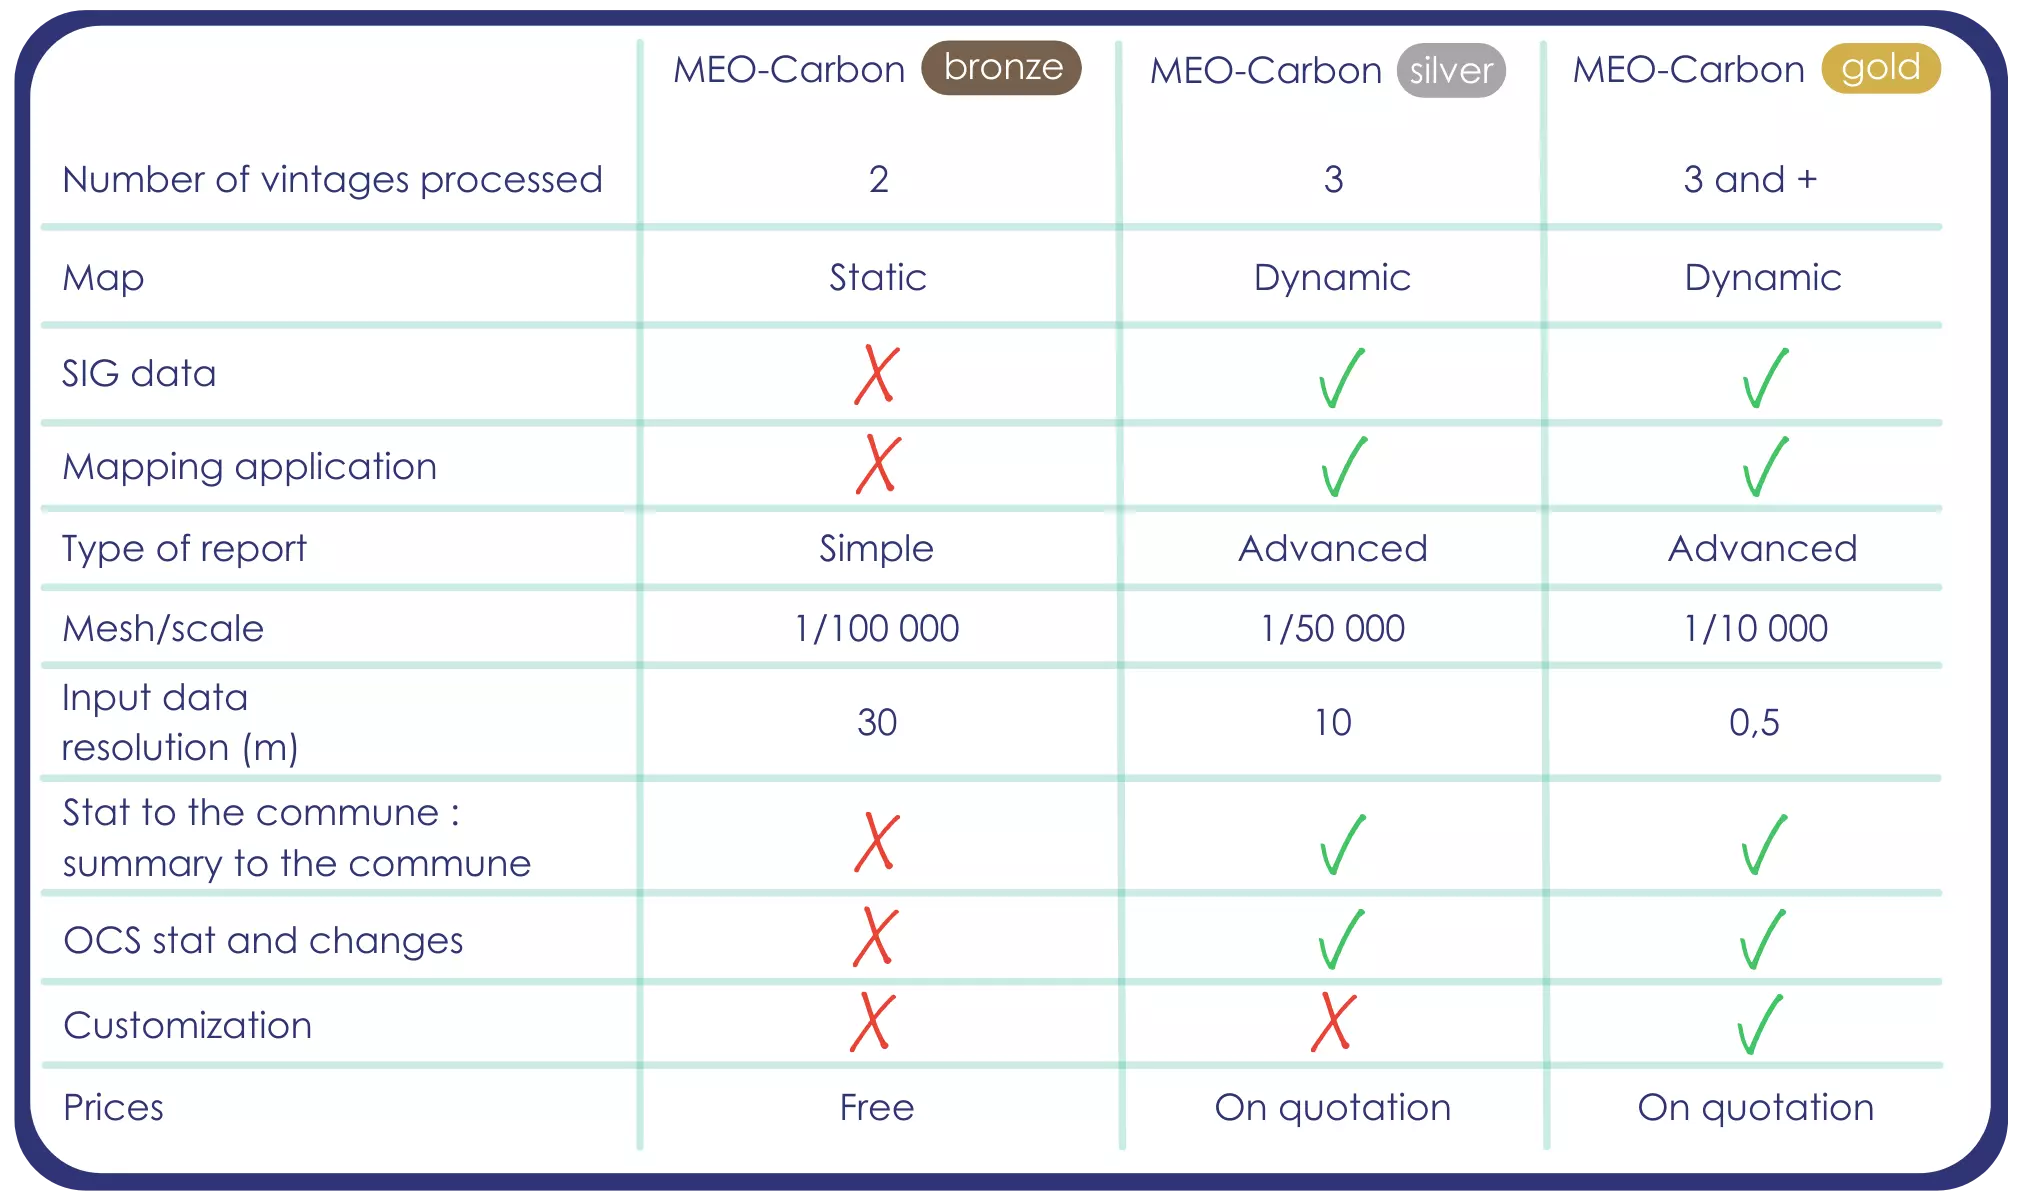
MEO-Carbon bronze
- Data used : Corine Land Cover
- Minimum mapping unit/object width : 25 hectares / 100 m
- Available vintages : 2012, 2018
- Size of the mesh : 25 hectares
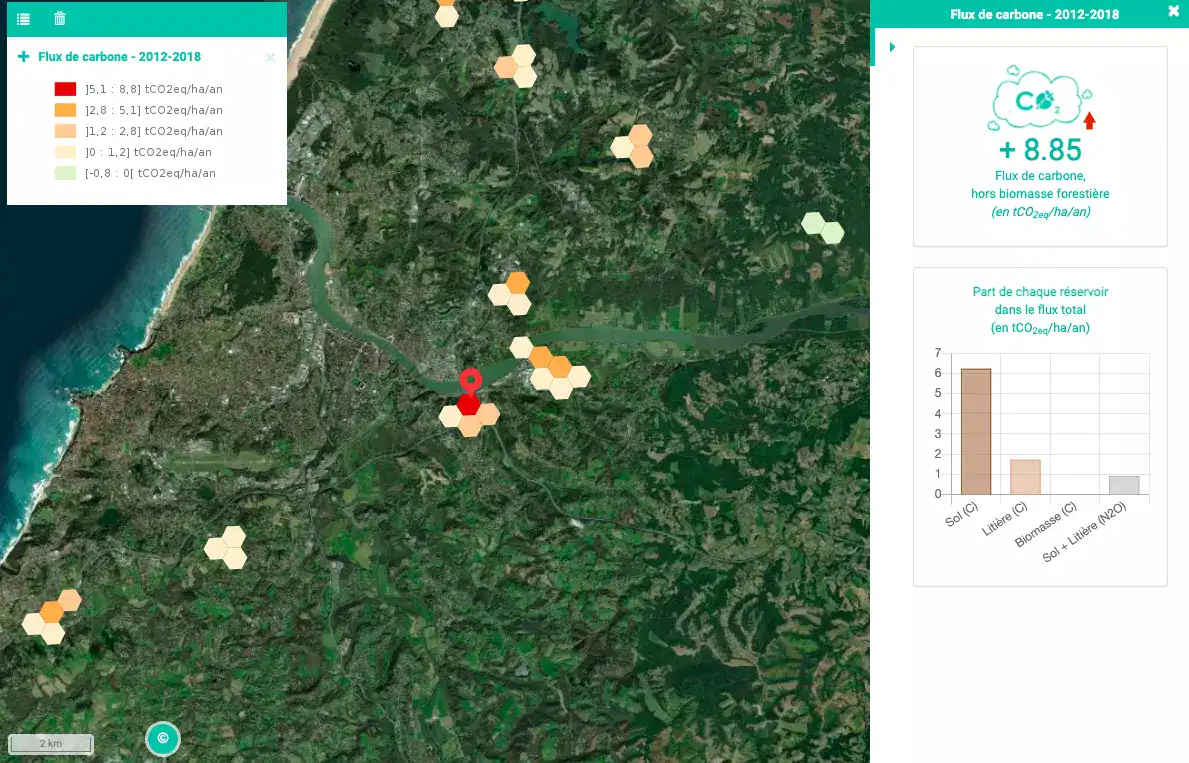
Carbon flows (level 1) between 2012 and 2018
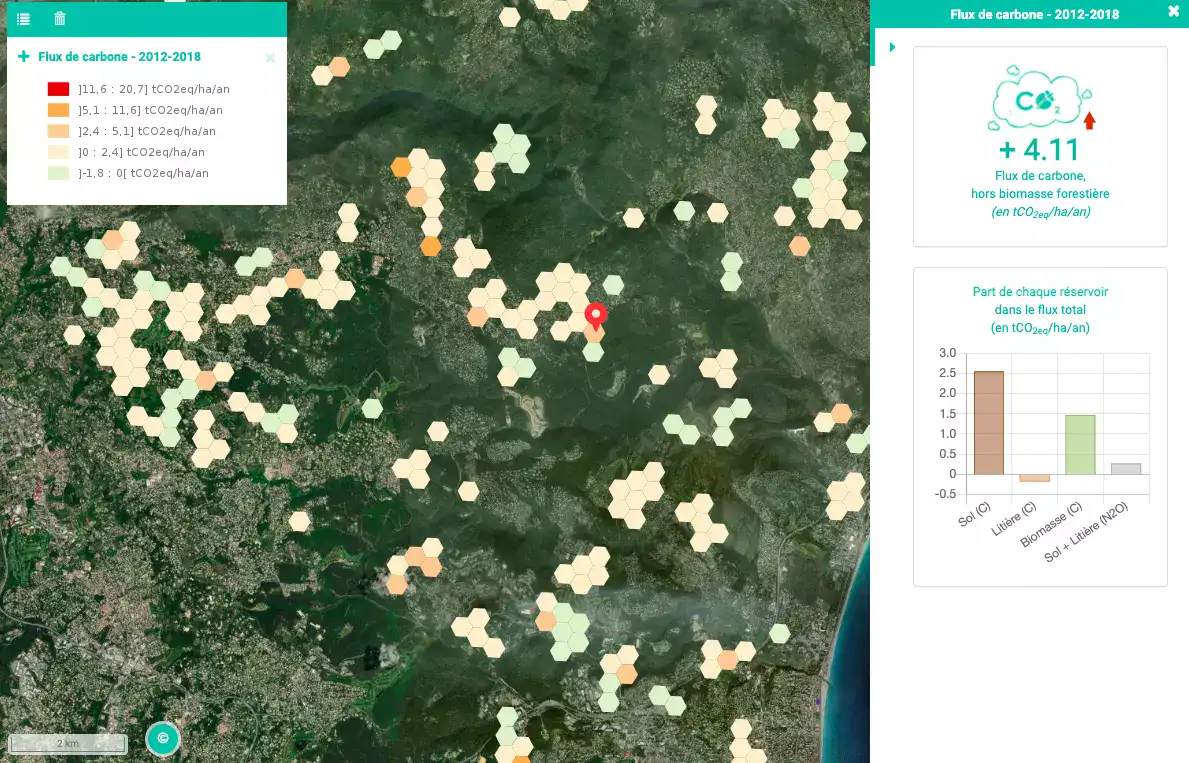
Carbon flows (level 2) between 2012 and 2018
MEO-Carbon silver
- Data used : Copernicus data (HR-Layers, UrbanAtlas), RPG, etc.
- Resolution : 20 m
- Available vintages : 2015, 2018
- Size of the analysis grid : 10 hectares
MEO-Carbon gold
- Data used : Local land use, orthophotographs, THR satellite images
- Available vintages : according to available data and/or request
- Size of the analysis grid : 5000 m².
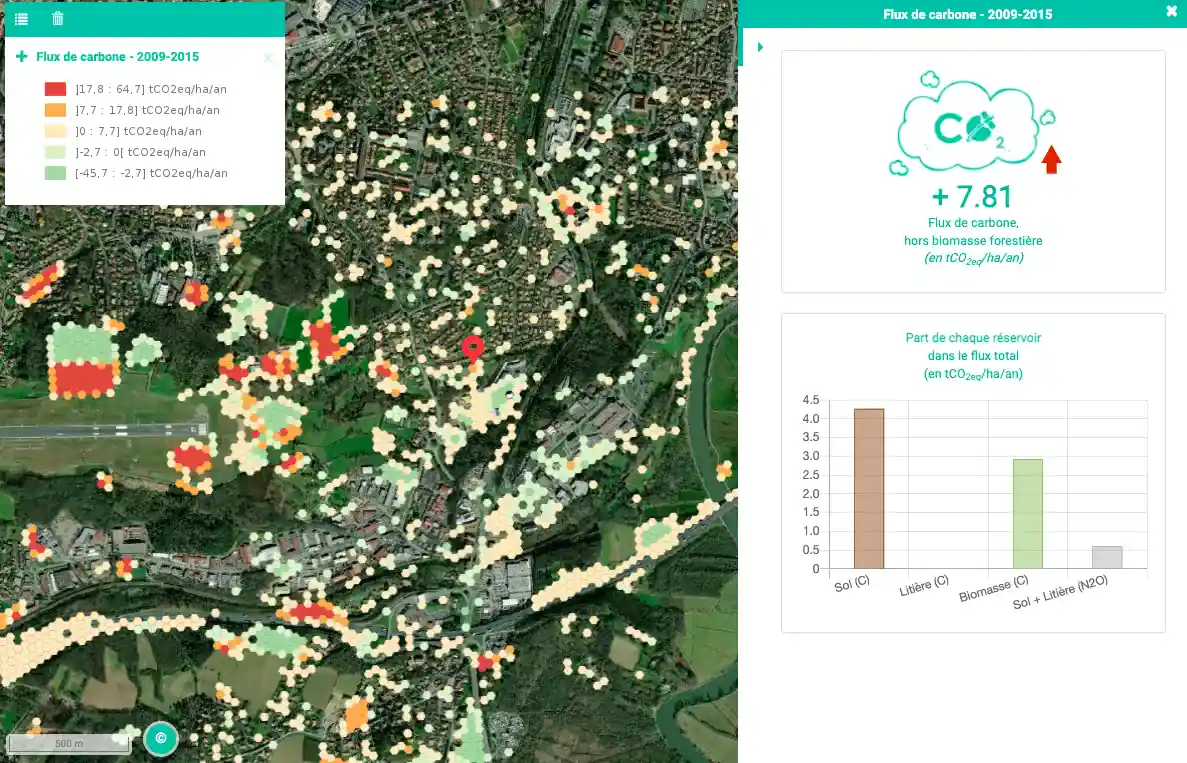
Carbon flows (level 3) between 2009 and 2015
Don’t wait any longer, ask for your FREE report !
MEO-Carbon comparison table
